Program development
When the NRC released its bold vision for the future of science education in its 2010 Framework for K-12 Science Education, the science pedagogy leaders at the Lawrence Hall of Science quickly began to consider how the concepts could be implemented in real life classrooms with diverse student bodies. Therefore, when the Next Generation Science Standards were released later, in 2013, the team was ready to respond with alacrity, putting their heads down immediately to get to work creating a brand new curriculum that would be built from the ground up to address the standards. Though the Lawrence Hall of Science already had a bevy of outstanding programs in their portfolio of curricula, the Learning Design Group of LHS chose not to merely redesign an existing program in order to check the NGSS boxes, but instead to honor the pedagogical shift by creating something truly birthed from the new standards. A rigorous research and development process, described in the sections below, thus ensued.
Field testing and revisions
After completion of pilot-test-informed revisions, the Lawrence Hall of Science conducted large-scale field tests to test how well the materials worked in the hands of real teachers, and in a wide range of classrooms. More than 475 teachers and 34,000 students in cities, suburbs, and rural communities across the country thus used Amplify Science in their classrooms between 2014–2016. Students who participated benefited from their use of the curriculum. See below for a discussion of some of the insights gleaned from these field tests:
Findings from first-grade field tests
As part of a Department of Education-funded project (First Grade Second Language: Uniting Science Knowledge and Language Development for English Learners), the developers at the Lawrence Hall of Science conducted classroom implementation trials of first-grade Amplify Science units.
Scores on outcome measures for students in the classrooms assigned to teach Amplify Science were compared to scores for a similar number of students in classrooms using a business-as- usual curriculum. The study looked at three measures of performance (unit-aligned assessments of science vocabulary knowledge, reading comprehension of informational texts, and science knowledge), comparing the pre-to-post gains of students in the Amplify unit to the business-as-usual curriculum. In all comparisons, the Amplify Science treatment group outperformed the business-as-usual group, and in some cases by a large margin. The control group never outperformed the treatment group, and the treatment achieved a moderate effect size (.4<ES<.6). The effect size is a measure of practical significance–the magnitude of change between pre-test and post-test. A statistic called Cohen’s d was used, the value of which ranges from 0 (no change) upwards. In education, researchers typically consider effect sizes of 0.4 to be better than average. Effect sizes of 0.6 or greater indicate a highly successful program, and are considered excellent.
Effect Sizes in Classroom Implementation Trial
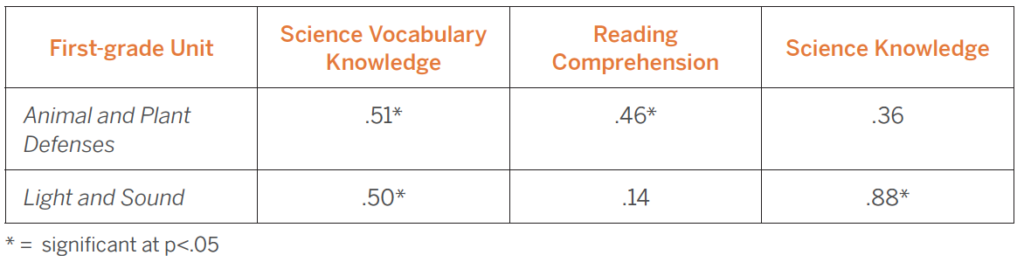
Importantly, students demonstrated substantial growth in vocabulary knowledge and in their capacity to describe challenging science concepts. Furthermore, when asked, all of the teachers who participated overwhelmingly responded that they would teach the Amplify Science units again if given the opportunity. Positive results and feedback were also received from field tests of all other elementary grades, as well.
Findings from grades 6-8 field tests
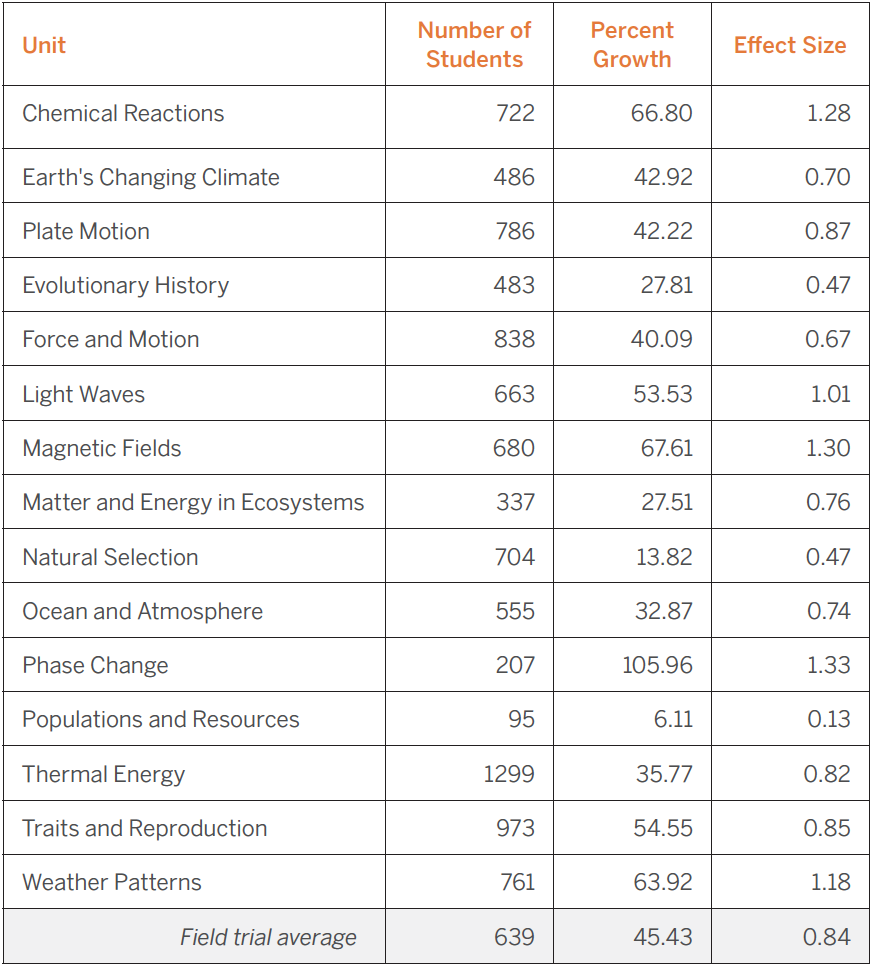
During field tests for each middle school unit, students responded to an assessment prior to instruction and again immediately upon concluding the unit. Each of these pre-unit and post-unit assessments were scored, and student growth was calculated using percent growth and effect size measures (Cohen’s d).
The percent-growth results indicate how much better the class sections did on average between pre-test and post-test. On average, there was a 46 percent growth in student knowledge across the middle school units. Translated into letter grades, that is equivalent to a student increasing two letter grades.
Another way to measure efficacy is by looking at the effect size of the student growth. The effect sizes on student growth during the field tests of Amplify Science middle school units were medium to large. With only one exception (Populations and Resources at 0.129), all units had an effect size on student achievement between 0.5 and 1.4. The average effect size across units was 0.84, which is an excellent outcome.
The percent growth and Cohen’s d effect size measures are given for each unit in the table below. Given these results, the typical teacher might expect student knowledge to increase by 50 percent or more per unit, or roughly a 1–2 letter grade improvement.
Knowledge growth and practical effect sizes
After the field tests were completed, the Lawrence Hall of Science organized the copious amount of teacher feedback and student data (such as the above), and proceeded to revise and rewrite the units, as needed. Each unit underwent several months of revisions, with changes made to lesson content, technology, artwork, media, and kit materials. From initial drafts written in 2014, through the large-scale field tests of 2014–2016, all unit revisions were finally complete for the 2016–2017 school year, just in time for teachers to usher in the new year with a fully-formed, effective, and NGSS designed resources to use with their students.
Recent Results and Ongoing Research
The results below are from classrooms across the country that started implementing the finished Amplify Science curriculum starting in the fall of 2017 or later. The most notable data point, depicted in the graphs that follow, is the number of students who moved from the lowest to highest level in the learning progression (0 to 3 in unit’s “Progress Build”) over the course of the unit (generally 6 weeks):
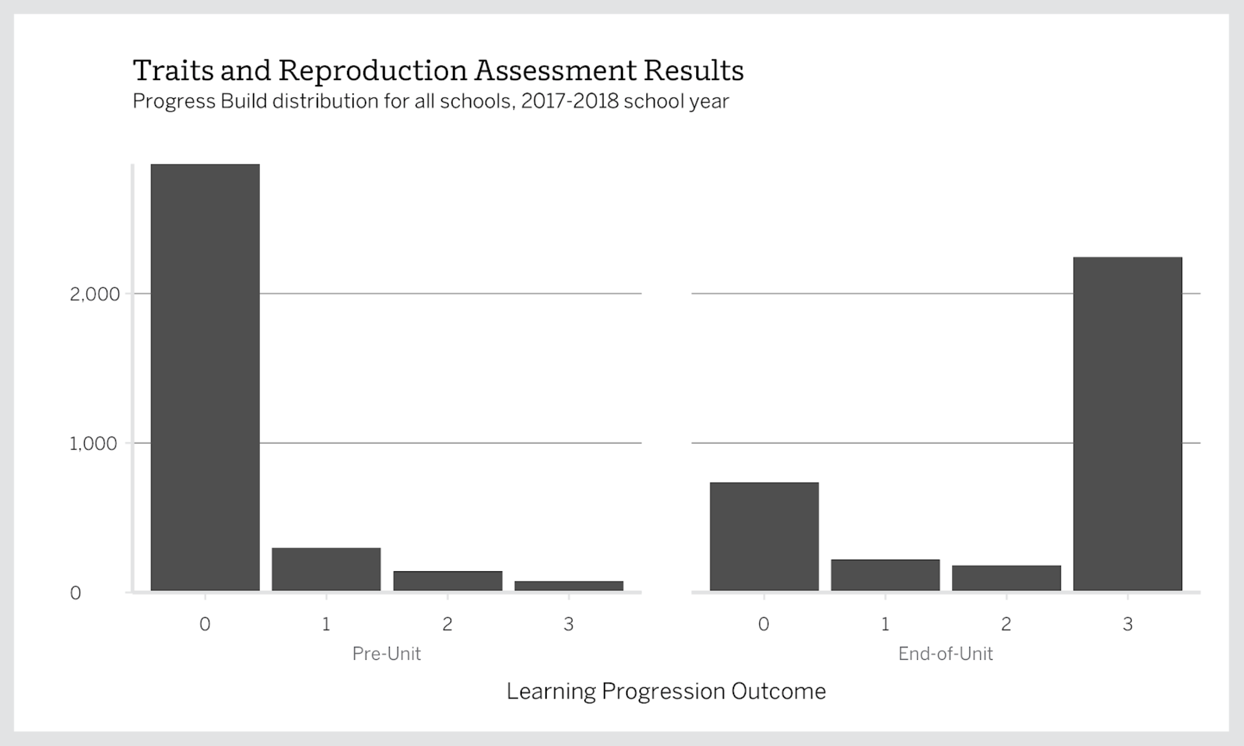
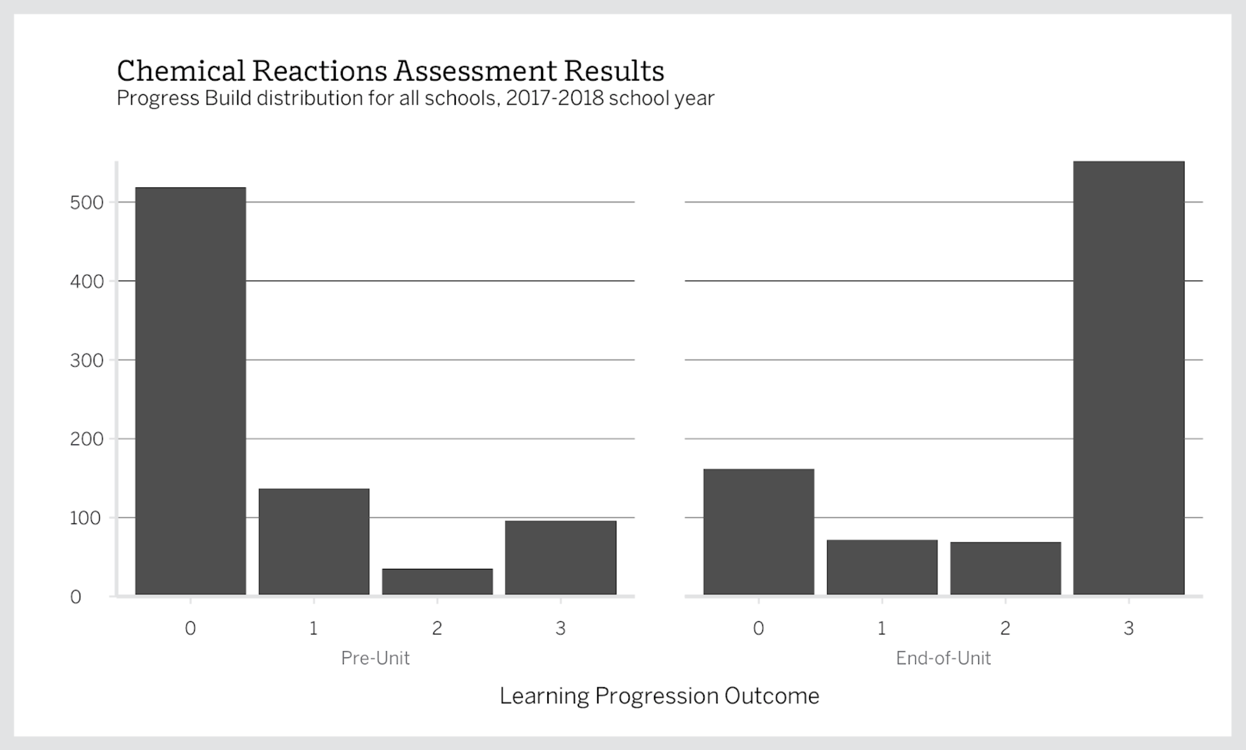
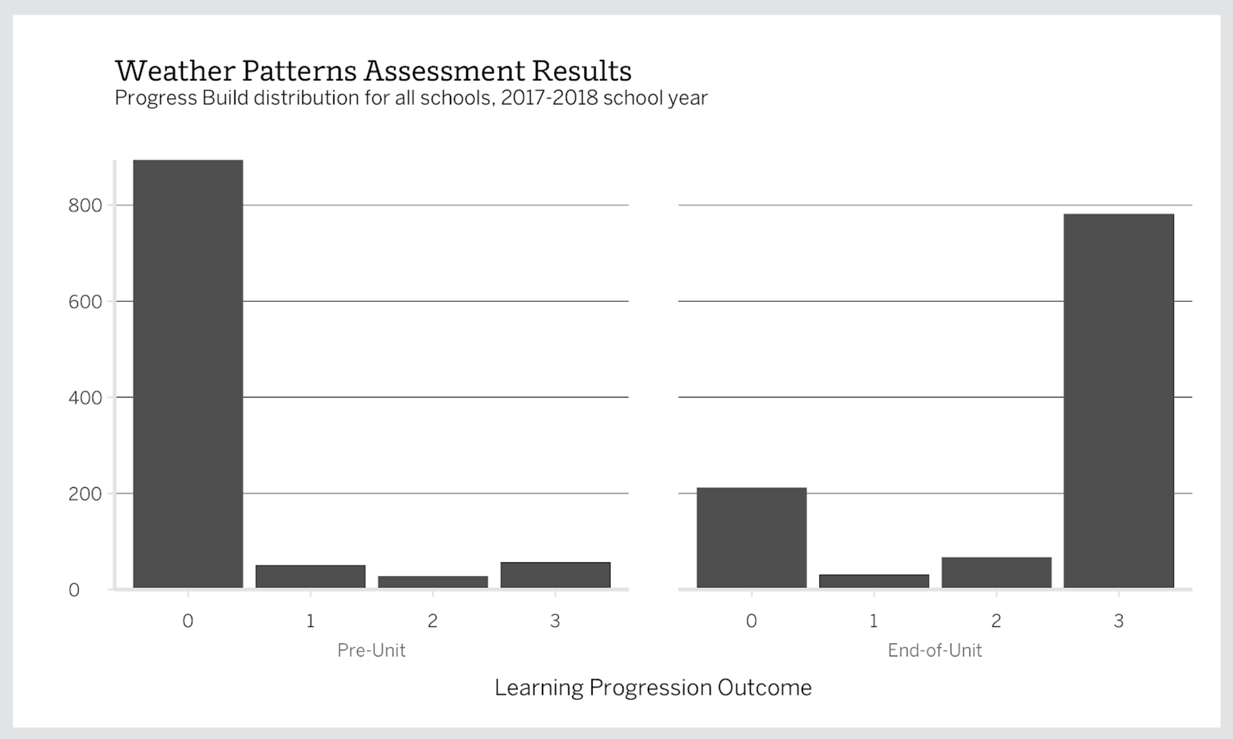
The charts above show movement through the learning progression over the course of one unit of study. The learning progression in Amplify Science is outlined in what we call the Progress Build.
Additionally, the table below shows average Student Knowledge Growth from the 2016–2017 and 2017–2018 school years, respectively. Student Knowledge Growth is the amount by which percent correct scores between Pre-Unit Assessments and End-of-Unit Assessments increased across the program.
| School Year | Student Knowledge Growth |
|---|---|
| 2016–2017 | 88.63% |
| 2017–2018 (fall semester only) | 89.91% |
As can be seen from the table, relevant outcomes are in the positive direction, indicating a favorable outcome. The suggested effects will be investigated further, but these initial results are highly encouraging.
More plans for researching efficacy are underway, including a randomized control efficacy study in the 2018–2019 school year. This study will be conducted by SRI International, an independent third-party research organization. Preliminary results will be available in 2019.